Winter so far – 20th February rainfall update

The latest rainfall update from the Met Office National Climate Information Centre shows that this has been the UK’s wettest winter on record in the national series going back to 1910.

These provisional rainfall statistics for the winter so far (from 1 December 2013 to 19 February 2014) show new records for the UK, Wales, east Scotland, southwest England & south Wales alongside the record already set for southeast & central southern England.

Rainfall precentage of average 1 Dec 2013 - 19 Feb 2014

Rainfall precentage of average 1 Dec 2013 – 19 Feb 2014

With just over a week to go until the end of the season:

  • The UK has now received 486.8mm of rain, narrowly above the previous record of 485.1mm set in 1995.
  • Wales has seen 691.8mm of rain, beating the previous record of 684.1mm in 1995.
  • East Scotland has seen 514.5mm of rain, beating the previous record of 482.2mm in 1915.
  • Southwest England and south Wales has seen 632.5mm of rain beating the previous record of 610.7mm in 1990.
  • Southeast and central southern England has seen 492mm beating the previous record of 437.1mm set in 1915.

All countries and areas are also on target for a warmer than average winter.

Current record wettest winters:

Country Year Rainfall Winter 2014 to date*
UK 2014 486.8mm New record
ENGLAND 1915 392.7mm 370.4mm
WALES 2014 691.8mm New record
SCOTLAND 1995 649.5mm 634.3mm
NORTHERN IRELAND 1994 489.7mm 434.5mm

*These are provisional figures from 1 December 2013 to 19 February 2014 and could change after final quality control checks on data.

Posted in Met Office News | Tagged , , , , | 7 Comments

Winter so far – 18th February rainfall update

As the UK heads into a period of more normal unsettled winter weather weather, the Met Office’s National Climate Information Centre has looked at statistics for this winter so far (from 1 December 2013 to 13 February 2014).

These add to previous facts and figures we put out earlier this month, and show a picture of continuing exceptional rainfall across many areas.

Looking at regions around the UK, these provisional figures show the region of central southern and southeast England has already exceeded its record winter rainfall in the series back to 1910. Rainfall here currently at 459.3mm*, 22mm above the previous record of 437.1mm set in 1915 with two weeks still to go to the end of the season. This winter also currently ranks as the 4th wettest winter (if there is no further rain) for southwest England and south Wales combined and the 3rd wettest for England South.

Both the UK as a whole and Wales are fairly close to exceeding their respective record wettest winter levels in the national series dating back to 1910 (see table below). Average rainfall for the rest of the month could see those records broken.

All countries across the UK have already exceeded their typical average rainfall for the whole winter (according to the 1981-2010 long-term averages). Normally at this stage of the season, you’d expect to have seen only around 80% of that whole season average.

All areas are also on target for a significantly wetter than average winter, with typically around 130-160% of normal rainfall if we get average rainfall for the rest of February.

All countries and areas are also on target for a warmer than average winter.

Current record wettest winters:

Country Year Rainfall Winter 2014 to date*
UK 1995 485.1mm 452.6mm
ENGLAND 1915 392.7mm 345.6mm
WALES 1995 684.1mm 645.1mm
SCOTLAND 1995 649.5mm 590.4mm
NORTHERN IRELAND 1994 489.7mm 386.2mm

*These are provisional figures from 1 December 2013 to 13 February 2014 and could change after final quality control checks on data.

Posted in Met Office News | Tagged , , , , , , , , , | 3 Comments

Met Office in the Media: 16 February 2014, response by Professor Mat Collins and the Met Office

An article by David Rose appeared yesterday in the Mail on Sunday entitled: ‘No, global warming did NOT cause the storms, says one of the Met Office’s most senior experts’

In it he says that Mat Collins, Professor in Climate Systems at Exeter University, ‘appears to contradict’ the report released by the Met Office last weekend and that he ‘declined to comment on his difference in opinion’ with one of the report’s authors, Dame Julia Slingo.

This is not the case and there is no disagreement.

The report by the Met Office states that “As yet, there is no definitive answer on the possible contribution of climate change to the recent storminess, rainfall amounts and the consequent flooding. This is in part due to the highly variable nature of UK weather and climate.”   This agrees with the latest IPCC Report that states: “Substantial uncertainty and thus low confidence remains in projecting changes in Northern Hemisphere storm tracks, especially for the North Atlantic basin.”

This is the basis for Prof Collins’ comment and means that we are not sure, yet, how the features that bring storms across the Atlantic to the UK – the jet-stream and storm track – might be impacted by climate change. As the Met Office report highlights for this year’s extreme conditions, there are many competing factors – from changes in the winds of the upper atmosphere to disturbed weather over Indonesia.

What the Met Office report – and indeed the IPCC – does say is that there is increasing evidence that extreme daily rainfall rates are becoming more intense. It is clear that global warming has led to an increase in moisture in the atmosphere – with about four per cent more moisture over the oceans than in the 1970s – which means that when conditions are favourable to the formation of storms there is a greater risk of intense rainfall. This is where climate change has a role to play in this year’s flooding.

With respect to changes in storminess, the good news is that recent advances in climate science are starting to pay dividends. Improved spatial resolution in models – that means that they can model weather and climate in more spatial detail – is allowing the models to represent some of the key factors that drive regional weather patterns. As the Met Office report states ‘With a credible modelling system in place it should now be possible to perform scientifically robust assessments of changes in storminess, the degree to which they are related to natural variability and the degree to which there is a contribution from human-induced climate change.’

Posted in Met Office in the Media, Met Office News | Tagged , , , , , | 112 Comments

Met Office rainfall records – how far do they go back and what can they tell us?

As we have seen over recent weeks and months, observations for the UK are essential to put recent weather into context and to detect variations and possible long-term trends in UK climate. So, when the Met Office quotes “the wettest on record” what does that mean?

Station records
All our time-series of rainfall come from observations made by rain gauges and their length is determined by how long the recording stations have been open.

Stations with long records are a very important part of the UK’s weather station network. These time series provide an accurate picture of rainfall for that particular location, provided there are no significant changes in instrument type or station exposure. One of the longest in the UK is the weather station at Oxford Radcliffe Observatory, which holds nearly 250 years of rainfall observations from 1767 to the present day and is maintained by Oxford University School of Geography and the Environment.

This will give an accurate picture of rainfall for the city and will be broadly representative of the year-to-year variations of rainfall across Oxfordshire or even central England, but it won’t be useful when looking more widely across England and Wales or the UK.

Regional records
So, to accurately make comparisons across regions and countries we need to create a different time-series.

One way of doing this is to calculate the average of different weather stations across an area – for example England and Wales. The England and Wales Precipitation series (EWP) is such a series of monthly rainfall totals from 1766 to the present day. For the most recent decades, the EWP series is based on over 100 stations, although this number decreases as you go back through the 20th, 19th and 18th Centuries.

The EWP series is much more reliable than a single station at representing rainfall for England and Wales overall and, because it extends back to 1766, it is very important climate series.

However, it does not cover the whole of the UK or take full advantage of the complete network of several thousand stations currently recording rainfall across the country.

National records
Met Office national records are created using gridded datasets which interpolate observations from the full network of stations onto a 5km by 5km grid covering the UK. The gridding method is a more sophisticated approach for analysing rainfall than simply taking an average of station data. However, because it is a digital series it is shorter than the EWP – the number of rain gauges with data in our electronic archive decreases rapidly by the early 20th Century.

So, the UK’s national climate series – the records you will see quoted when the Met Office releases statistics – is a comprehensive gridded rainfall analyses back to 1910. This series provides the best estimate of overall rainfall and its distribution across the UK.

The gridded rainfall analysis also enables us to produce maps showing UK rainfall patterns, for example January 2014:

Rainfall anomaly January 2014

Rainfall anomaly January 2014

How do the series compare?
Here are the headlines for January 2014:

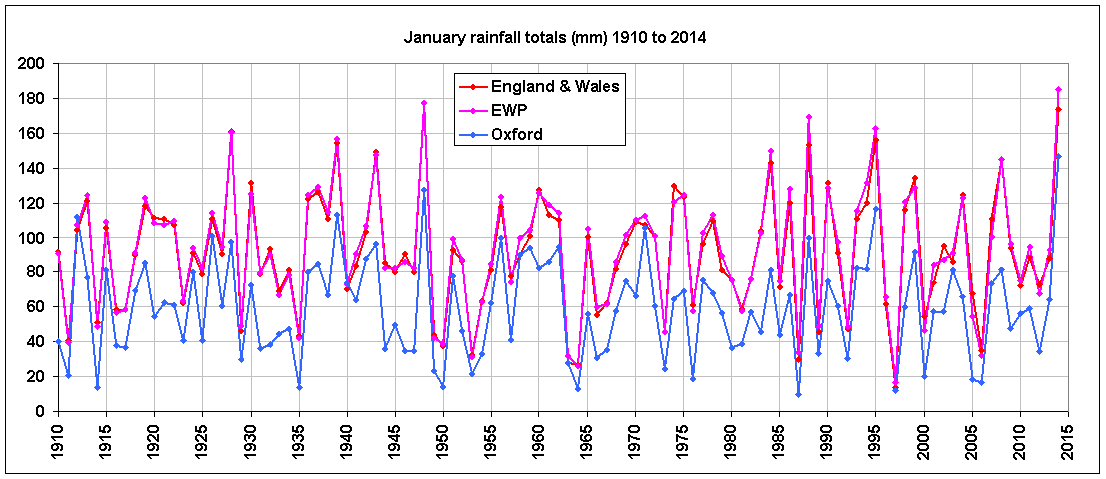
  • For the England & Wales areal series, January 2014 (173.5mm) was the wettest January since 1948 (176.8mm) and the second wettest January in the series from 1910
  • For the EWP series, January 2014 (185.0mm) was the wettest January in the series from 1766, marginally wetter than 1948 (176.8mm)
  • For Oxford, January 2014 (146.9mm) was the wettest January in the series from 1767, wetter than 1852 (138.7mm)

You can see from the graph below that the EWP and the national England & Wales series both represent the same area and are very similar. Rainfall totals for the Oxford Radcliffe Observatory series are generally lower.

For any individual year there can be significant differences between series. For example we would probably conclude that January 1988 was climatologically more extreme for England and Wales than for Oxford, similarly 1997 is the driest January for England and Wales by a reasonable margin, but there are a number of similarly dry or drier Januarys than 1997 for Oxford.

January rainfall comparison

January rainfall comparison

So which is the best series to use?
Well, the answer is that we need to use them all. The Met Office routinely quotes rainfall statistics based on the gridded data, because these are considered the most reliable estimates, are based on the full network of observations, and can provide the regional pattern of rainfall.

The EWP series is an invaluable climate series because it provides a much longer near 250-year perspective but has less regional detail.

However, our climate analyses would not be possible without the long running high quality individual station series such as Oxford. These are the foundations of historical climate analysis.

Posted in Met Office News | Tagged , , , , , , , | 2 Comments

January weather summary

January saw a succession of weather systems tracking across the UK from the Atlantic which brought high winds, at times gale force, and persistent rain to the country. This extended a sequence of deep lows that began in mid-December. The worst of these were over by the 7th to give some brief respite, but rain continued through the remainder of the month with very few dry days. For the period from 12th December to the end of January some stations in the south of England had recorded over five months worth of rainfall.

The UK mean temperature for January was 4.8 °C, which is 1.1 °C above the 1981-2010 average. The UK overall received 151% of average rainfall making it the third wettest in the series. A broad region from east Devon to Kent and up to the central midlands received well in excess of 200 % and some more localised regions were closer to three times the average. Visit our climate section for a full written summary of the month.

Our infographic and video provide a summary of the weather throughout January:

14_0062-jan-summary-infog

Posted in Met Office News | Tagged , , , , , , , | Comments Off on January weather summary

12 February 2014 – Storm Statistics

The UK saw severe weather conditions throughout the course of Wednesday 12 February 2014 and as forecast the strongest winds hit the Welsh and Northwestern coast. Below you can see the highest gusts of wind and rainfall totals recorded at Met Office observing sites on Thursday 12 February 2014.

Maximum gust speeds:

Site Area Elevation (m) Max gust speed (mph)
ABERDARON GWYNEDD 95 108
MUMBLES HEAD WEST GLAMORGAN 43 96
WIGHT: NEEDLES OLD BATTERY ISLE OF WIGHT 80 96
LAKE VYRNWY POWYS 360 96
CAPEL CURIG NO 3 GWYNEDD 216 93
HIGH BRADFIELD SOUTH YORKSHIRE 395 92
PEMBREY SANDS DYFED 3 89
ABERPORTH DYFED 133 87
LOFTUS CLEVELAND 158 85
BERRY HEAD DEVON 58 85

Rainfall totals:

Site Area Rainfall (mm)
SHAP CUMBRIA 46
BAINBRIDGE NORTH YORKSHIRE 41
BALLYPATRICK FOREST ANTRIM 39
CAPEL CURIG NO 3 GWYNEDD 37.4
BANAGHER, CAUGH HILL LONDONDERRY 35.8
BALA GWYNEDD 32.8
ALTNAHINCH FILTERS ANTRIM 32.4
KESWICK CUMBRIA 29.6
PATELEY BRIDGE, RAVENS NEST NORTH YORKSHIRE 27.4
TREDEGAR, BRYN BACH PARK GWENT 26.8

The unsettled weather will continue over the next 48 hours with a system bringing heavy rain on Friday 14 February, however the latter part of the weekend should bring drier and brighter weather for many. Everyone is advised to stay up to date with the latest Met Office forecasts and National Severe Weather Warnings and find out what to do in severe weather.

Posted in Met Office News | Tagged , , , | Comments Off on 12 February 2014 – Storm Statistics

Statistics for winter so far

As the unsettled UK weather continues this week, the Met Office’s National Climate Information Centre have looked at statistics for this winter so far (from 1 December to 10 February).

These add to previous facts and figures we put out earlier this week, and show a picture of continuing exceptional rainfall across many areas.

Looking at regions around the UK, these provisional figures suggest the region of SE and Central S England has already exceeded its record winter rainfall in the series back to 1910. It is currently at 439.2mm*, less than 2mm above the previous record set in 1915 with 437.1mm of rain.

For the UK as a whole, and also for Wales, both are fairly close to their respective record wettest winter levels in the national series dating back to 1910. Average rainfall for the rest of the month would likely see those records broken.

All countries across the UK have already exceeded their typical average rainfall for the whole winter (according to the 1981-2010 long-term averages). Normally at this stage of the season, you’d expect to have seen only around 80% of that whole season average.

All areas are also on target for a significantly wetter than average winter, with typically around 130-160% of normal rainfall if we get average rainfall for the rest of February.

All countries and areas are also on target for a warmer than average winter.

Current record wettest winters:

Country Year Rainfall Winter 2014 to date*
UK 1995 485.1mm 429.2mm
ENGLAND 1915 392.7mm 328.0mm
WALES 1995 684.1mm 618.7mm
SCOTLAND 1995 649.5mm 558.5mm
NORTHERN IRELAND 1994 489.7mm 360.0mm


*These are provisional figures from 1 December 2013 to 10 February 2014 and could change after final quality control checks on data.

Posted in Met Office News | Tagged , , , , , , , | 7 Comments

UK’s exceptional weather in context

As the UK’s run of exceptionally wet and stormy weather continues, the Met Office’s National Climate Information Centre has looked at how the last two months compare in the historical records.

Here’s some facts and figures for the weather we’ve seen through December and January:

For the UK

  • For the UK, December was provisionally the equal-fifth wettest December in the national series dating back to 1910 and January was the third wettest January in the same record. When the two months are combined, it is provisionally the wettest December and January in the series.
  • There were more days of rain (any day with more than 1mm of rainfall) for the UK in January than for any other month in a series dating back to 1961, with 23 days.
  • It was the windiest December for the UK in records back to 1969, based on the occurrence of winds in excess 60 kts (69mph).

England and Wales

  • Looking at the England and Wales Precipitation series, which dates back to 1766, it has been the wettest December to January since 1876/1877 and the 2nd wettest overall in the series.

Scotland

  • December was the wettest calendar month on record for Scotland in the series to 1910.
  • For eastern Scotland, December and January combined was provisionally the wettest two month (any-month) period in the same series.

Southern England

  • There have been very few dry days in this area since 12 December and regional statistics suggest that this is one of, if not the most, exceptional periods of winter rainfall in at least 248 years.
  • Despite the rainfall being concentrated in the second half of the month it was the wettest December for south east England since 1959.
  • January was the wettest January for the south England region in the national series dating back to 1910, and the wettest calendar month for the south east region in the same series by a huge margin.
  • The two-month total of 372.2mm for the southeast and central southern England region is the wettest any 2-month period in the series from 1910 .
  • From 12th December to 31st January parts of south England recorded over five months worth of rainfall (based on average January rainfall for the region).

You can see more statistics on recent weather and through the historical records on our UK climate pages.

Full month provisional statistics from January 2014:

Mean Temperature Sunshine hours Rainfall  
January
Actual Diff from Avg Actual % of Avg Actual % of Avg
  degC degC hours % mm %
UK 4.8 1.1 44.8 95 183.8 151
England 5.4 1.3 57.3 106 158.2 191
Wales 5.3 1.2 38.0 78 269.0 171
Scotland 3.5 0.9 27.2 76 205.3 116
N Ireland 4.5 0.3 37.3 84 170.7 147
Posted in Met Office News | Tagged , , , , , , , , , , , | 9 Comments

Wind gusts and rainfall totals 4-5th February 2014

Last night another major Atlantic depression affected the UK, bringing further heavy rain and severe gales.

Here are some of the highest gusts of wind and rainfall totals recorded at Met Office observing stations between 3pm yesterday and 8am today.

Location Area Height (m) Max gust (mph)
SCILLY: ST MARYS AIRPORT ISLES OF SCILLY 31 92
BERRY HEAD DEVON 58 91
CULDROSE CORNWALL 76 76
WIGHT: NEEDLES OLD BATTERY ISLE OF WIGHT 80 71
PLYMOUTH, MOUNTBATTEN DEVON 50 71
ABERPORTH DYFED 133 70
CARDINHAM, BODMIN CORNWALL 200 70
ISLE OF PORTLAND DORSET 52 70
ST BEES HEAD NO 2 CUMBRIA 124 68
CAMBORNE CORNWALL 87 67
CAPEL CURIG NO 3 GWYNEDD 216 66
GUERNSEY: AIRPORT GUERNSEY 101 64
ORLOCK HEAD DOWN 35 64
MILFORD HAVEN DYFED 44 63
POINT OF AYRE ISLE OF MAN 9 62
NORTH WYKE DEVON 177 61
JERSEY: AIRPORT JERSEY 84 61
PEMBREY SANDS DYFED 3 61
DUNKESWELL AERODROME DEVON 252 60
MUMBLES HEAD WEST GLAMORGAN 43 60
Location Area Rainfall (mm)
NORTH WYKE DEVON 33.4
CAMBORNE CORNWALL 25.2
DUNKESWELL AERODROME DEVON 24.6
CARDINHAM, BODMIN CORNWALL 24.4
BANAGHER, CAUGH HILL LONDONDERRY 24.0
KATESBRIDGE DOWN 23.8
HIGH WYCOMBE, HQAIR BUCKINGHAMSHIRE 21.4
LISCOMBE SOMERSET 21.4
EXETER AIRPORT DEVON 21.2
DALWHINNIE INVERNESS-SHIRE 18.6
ALICE HOLT LODGE HAMPSHIRE 18.4
OKEHAMPTON DEVON 17.9
CULDROSE CORNWALL 17.6
BENSON OXFORDSHIRE 17.6
ODIHAM HAMPSHIRE 17.2
BUDE CORNWALL 17.0
CARTERHOUSE ROXBURGHSHIRE 17.0
CHARLWOOD SURREY 17.0
UPPER LAMBOURN BERKSHIRE 16.8
TREDEGAR GWENT 16.6

Further severe gales and heavy rain are expected over the next few days and everyone is advised to stay up to date with the latest Met Office forecasts and National Severe Weather Warnings and be prepared that the weather may change or worsen, leading to disruption of your plans.

Posted in Met Office News | Tagged , , , , , , | Comments Off on Wind gusts and rainfall totals 4-5th February 2014

The 2013 global mean temperature

In December 2013 we published an estimate of the global mean temperature up to the end of October 2013, based on an average of the three main global temperature datasets – Met Office and University of East Anglia (HadCRUT4), NOAA National Climatic Data Center (NOAA NCDC) and NASA Goddard Institute of Space Studies (NASA GISS).

The United Nations’ World Meteorological Organisation (WMO) and the IPCC’s provisional estimate global mean temperature for 2013 is 0.5 °C ± 0.1 °C above the long-term (1961-1990) average.

For HadCRUT4, the provisional estimate for the whole of 2013 is between 0.39 °C and 0.59 °C above the long-term (1961-1990) average of 14.0 °C, with a central estimate of 0.49 °C.

This means 2013 is in the top ten warmest years on record and we continue to see near record global temperatures like those which resulted in 2000-2009 being the warmest decade in the instrumental record.

As always the latest figure has generated interest in the media, which focuses on how it relates to previous forecasts from the Met Office.

The global mean temperature is just one of many indicators – including sea level rise, shrinking glaciers and reducing Arctic sea ice – that give even more confidence that the world is warming. Climate models are an invaluable tool in helping us to understand past changes and predict how temperatures may change in the future; they have provided overall good advice capturing and representing the warmer world we now live in.

We can see from the IPCC AR5 report figure below how global temperatures have risen since 1860 and how the latest provisional observational estimates still lie within the range of the forecast models. This figure also shows that, looking back over the entire observational record there are a number of occasions where the observations lie close to both the upper and lower bounds of the model simulations, so what we are seeing at the moment is nothing new.

Time series of global and annual-averaged surface temperature change from 1860 to 2012 showing results from two ensemble of climate models driven with natural forcings and human-induced changes in greenhouse gases and aerosols compared to observations of global mean temperature from three different datasets relative to 1880-1919. CMIP3 relates to the suite of climate models used in IPCC AR4 and CMIP5 those models used in IPCC AR5.*

Time series of global and annual-averaged surface temperature change from 1860 to 2012 showing results from two ensemble of climate models driven with natural forcings and human-induced changes in greenhouse gases and aerosols compared to observations of global mean temperature from three different datasets relative to 1880-1919. CMIP3 relates to the suite of climate models used in IPCC AR4 and CMIP5 those models used in IPCC AR5.*

So, why might the global mean temperature be different from forecasts? Well, we know that, due to the lack of long-term observing sites in polar latitudes, HadCRUT4 underestimates the contribution from Arctic warming which has accelerated in recent years.

There is also increasing scientific evidence that the current pause in surface warming is associated with natural variability in the global oceans, as they absorb heat from the atmosphere. Changes in the exchange of heat between the upper and deep ocean appear to have caused at least part of the pause in surface warming, and observations suggest that the Pacific Ocean may play a key role. You can find out more about the recent pause in warming here.

*Figure modified from Bindoff, N. L., P. A. Stott, K. M. AchutaRao, M. R. Allen, N. Gillett, D. Gutzler, K. Hansingo, G. Hegerl, Y. Hu, S. Jain, I. I. Mokhov, J. Overland, J. Perlwitz, R. Sebbari and X. Zhang, 2013: Detection and Attribution of Climate Change: from Global to Regional. In: Climate Change 2013: The Physical Science Basis. Contribution of Working Group I to the Fifth Assessment Report of the Intergovernmental Panel on Climate Change [Stocker, T. F., D. Qin, G.-K. Plattner, M. Tignor, S. K. Allen, J. Boschung, A. Nauels, Y. Xia, V. Bex and P. M. Midgley (eds.)]. Cambridge University Press, Cambridge, United Kingdom and New York, NY, USA, in press.

Posted in Met Office News | Tagged , , , , , , , , , | 16 Comments