
Since the Paris Agreement at COP21 in December 2015, the 1.5°C target as a limit for global warming is much discussed, but why 1.5°C?
Where did the 1.5°C target come from?
The concept of identifying a threshold for climate change has existed for over 30 years. Article 2 of the 1992 United Nations Framework Convention on Climate Change (UNFCCC) states:
“The ultimate objective of this Convention and any related legal instruments that the Conference of the Parties may adopt is to achieve, in accordance with the relevant provisions of the Convention, stabilization of greenhouse gas concentrations in the atmosphere at a level that would prevent dangerous anthropogenic interference with the climate system.”
A key consideration is around the definition of the term ‘dangerous’ in this context of anthropogenic climate change. A vast array of scientific research has been conducted looking at a wide range of topics considering the environment (coral bleaching, ice sheet stability, food and water security, forests & vegetation) and also the point at which climate tipping points could occur. Through the 1990s and early 2000s several nations determined that a good target with respect to Article 2 commitments and considerations around climate vulnerabilities was 2 °C above pre-industrial levels, to prevent worsening and potentially irreversible effects of climate change. This 2 °C target was agreed as a goal at COP16 in Cancun.
Research commissioned by the Alliance of Small Island States (AOSIS), in addition to further research and understanding of the impacts of climate change on sea level rise (including committed sea level rise from warming that has already occurred), resulted in a growing concern around future sea level at a 2 °C target. These concerns for AOSIS and other climate vulnerable countries building on scientific evidence from the IPCC 5th Assessment Report (including other impacts such as temperature extremes) fed into an expert led process under UNFCCC assessing the evidence related to 2 °C and found the 2 °C “guardrail” concept to be inadequate.
On 12 December 2015, the 196 parties at the 21st Conference of the Parties (COP21 – the UNs climate summit) adopted the Paris Agreement, which stated a goal to hold “The increase in the global average temperature to well below 2 °C above pre-industrial levels” and pursue efforts “to limit the temperature increase to 1.5 °C above pre-industrial levels.”
As well as the goal of a 1.5 °C limit becoming a stated target, the agreement stated “well below 2 °C” a change in tone from previous limits “of 2 °C”. The period defined as representing the “pre-industrial levels” was 1850-1900.
Does half a degree make any difference?
Figure 1 shows the differences in global mean warming over the whole year for a world that stabilises at either 1.5 °C, 2 °C or 4 °C. There are stark differences between the 2 °C and 4 °C worlds as you would well expect, but there are also noticeable differences between the 2 °C and 1.5 °C futures. In all three different warming level futures, the distribution of the amount of warming is varied across the world with a consistent pattern in all three futures. The greatest warming is projected over high latitudes, and on land compared to oceans in the mid-latitudes and tropics.
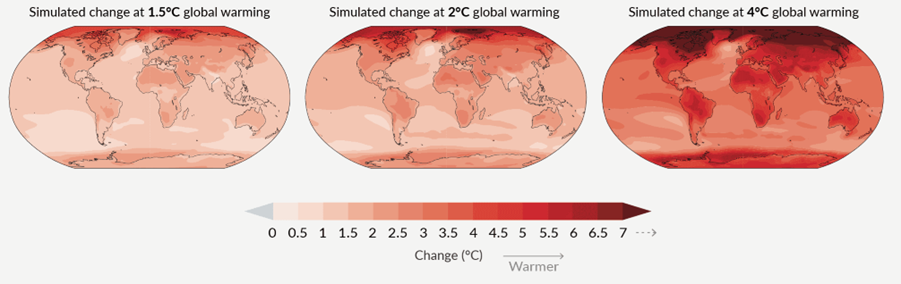
Comparing the 1.5 °C and 2 °C worlds, the distribution of warming is consistent between the two different futures. However, the magnitude of some of these changes can also be quite large. There are some noticeable changes in the high Arctic particularly for the Russian and Canadian Arctic coastlines, with increases in warming of 2 to 4 °C for these regions. Elsewhere, there are increases of around 1 to 1.5 °C in the USA, Europe, parts of Australia and the Antarctic seas, while in South America, Saharan Africa, Southern Africa, the Middle East and central Asia increases could be around 2 °C.
From Paris to present
As a response to the Paris Agreement, the Intergovernmental Panel on Climate Change (IPCC) was commissioned to produce a Special Report on Global Warming of 1.5 °C. The report indicated that crossing the 1.5 °C threshold risks the occurrence of far more severe climate change impacts, including more frequent and severe droughts, heatwaves, and rainfall. The report noted higher impacts on biodiversity and the number of species extinctions (both on land and in the ocean) and a 10 cm higher rise in global mean sea level in the 2 °C compared to the 1.5 °C future world.
To assess the progress of countries towards the goals of the Paris Agreement, each year countries release their Nationally Determined Contributions, the promises each country makes outlining their pathway to Net Zero, with each five-year cycle of reporting seeing increasingly ambitious targets. You can review the 2023 report from the UNFCCC here.
Pathways to 1.5 °C
The Special Report also discussed the pathways to 1.5 °C future, and the associated risks of any overshoots in these pathways. Based on climate model projections produced for the report, the mean time by which the world needs greenhouse gas emissions to peak is before 2025 with a decline of 43% (relative to 2019) by 2030, with Net Zero reached by 2050.
A single year?
For the year to date, 2023 looks well on course to become the warmest year on record, and predictions for the next five years indicate a 66% chance of one of those years exceeding 1.5 °C. As such, it is useful to understand how an individual year greater than 1.5 °C sits within the concept of limiting warming to 1.5 °C. Essentially, the question being: “If we have a year warmer than this threshold, then has the target already been missed?”
The simple answer is no. We have seen individual months above 1.5 °C and in November 2023 some days above 2 °C, these events, even an individual year above 1.5 °C would not constitute a breach of the Paris Agreement goal. However, as recently highlighted in a paper by Met Office scientists led by Richard Betts highlighted that the concept of a 1.5 °C world not formally defined in the Paris Agreement, and outlined different approaches that could be used to define a formal metric in the future.
A standard approach* within climate science would be to define it based on a climatological mean of 1.5 °C, which would be defined over a period of 20 years. Using this approach and using the HadCRUT dataset, the most recent 20-year period (2003-2022) has a 20-year global mean temperature anomaly of 1.03 °C warmer than the pre-industrial period of 1850-1900. Within this period, individual year temperatures have ranged from 0.81 °C (2004 & 2008) to 1.27 °C (2016) warmer than the pre-industrial period.
The variability around the mean temperature is representative of the role of natural variability within the Earth’s climate (for example, the warming effect of El Niño vs the cooling effect of La Niña). A 1.5 °C future world will also experience these variations and therefore there will be years when the climate is warmer and years when the world is cooler than 1.5 °C.
But, this same variability also means that in our present-day climate an individual year of 1.5 °C (or warmer) does not mean that we have reached the threshold of a 1.5 °C climate future. However, it is worth considering that whilst exceeding 1.5°C for a month or a year doesn’t represent a failure to achieve the longer-term Paris Agreement target, it does indicate that we are getting closer, and urgent action is needed to mitigate future warming and to adapt to increasing climate risks.
[1] – The recent paper by Betts et al. highlighted the risk of this approach that it results in a delay to the recognition of a threshold being crossed, in the case of a 20-year mean, this is around 10 years delay. They highlighted that current IPCC research indicates that the 1.5 °C future will be reached in 2030, but the 20-year mean approach won’t allow this to be formally recognised until 2040.

You must be logged in to post a comment.